Valgrind:C/C++分析工具
Valgrind:C/C++分析工具
Valgrind是開源的測試框架,可以用來動態分析記憶體配置、快取使用、多執行序bug。
安裝
$ sudo pacman -Sy valgrind
基本用法
$ valgrind 程式名稱 args
預設會是用memcheck工具分析,在這個工具下她會匯出heap使用、memory leak、還有記憶體使用錯誤的部份backtrace。
進階用法
$ valgrind --tool=toolname 程式名稱 args
這是valgrind最有方便的地方,valgrind旗下有九個使用者端的工具,和幾個開發者工具。
1. Memcheck:記憶體錯誤分析工具。
2.Cachegrind:預測你的cache使用。
3.Callgrind:分析程式的function call次數,還有call graph,可以幫助快取分析。
4.Helgrind:多執行序錯誤分析工具,有race condition檢測功能。
5.DRD:另一個多執行序分析工具。
6.Massif:分析heap的使用,在一個程式執行中她會測量多次。
7.DHAT:另一種heap分析工具。
8.SGcheck:實驗性的全域變數與stack分析工具。
9.BBV:實驗性SimPoint相關工具。
這些工具比較常用的是前七個。接下來看一下個別的使用。
memcheck
$ valgrind --tool=memcheck 程式名稱 args
首先我先寫一個廢物code來做實驗。以下code new完之後沒有delete。
#include<iostream>
using namespace std;
int main()
{
    int *ptr;
    ptr = new int;
    *ptr = 2;
    cout << *ptr << endl;
}
然後我們來看一下分析結果。
==12313== Memcheck, a memory error detector
==12313== Copyright (C) 2002-2015, and GNU GPL'd, by Julian Seward et al.
==12313== Using Valgrind-3.12.0 and LibVEX; rerun with -h for copyright info
==12313== Command: ./garbage
==12313==
2
==12313==
==12313== HEAP SUMMARY:
==12313== in use at exit: 4 bytes in 1 blocks
==12313== total heap usage: 3 allocs, 2 frees, 73,732 bytes allocated
==12313==
==12313== LEAK SUMMARY:
==12313== definitely lost: 4 bytes in 1 blocks
==12313== indirectly lost: 0 bytes in 0 blocks
==12313== possibly lost: 0 bytes in 0 blocks
==12313== still reachable: 0 bytes in 0 blocks
==12313== suppressed: 0 bytes in 0 blocks
==12313== Rerun with --leak-check=full to see details of leaked memory
==12313==
==12313== For counts of detected and suppressed errors, rerun with: -v
==12313== ERROR SUMMARY: 0 errors from 0 contexts (suppressed: 0 from 0)
她寫了definitely lost: 4 bytes in 1 blocks,int是4 byte,我new完之後沒有回收所以memory leak了4 byte,不過由於這程式很間單所以很好找到錯誤來源,當程式變得複雜時我們可以加上--leak-check=full來找到源頭,來看一加完的結果。
==14268== Memcheck, a memory error detector
==14268== Copyright (C) 2002-2015, and GNU GPL'd, by Julian Seward et al.
==14268== Using Valgrind-3.12.0 and LibVEX; rerun with -h for copyright info
==14268== Command: ./garbage
==14268==
2
==14268==
==14268== HEAP SUMMARY:
==14268== in use at exit: 4 bytes in 1 blocks
==14268== total heap usage: 3 allocs, 2 frees, 73,732 bytes allocated
==14268==
==14268== 4 bytes in 1 blocks are definitely lost in loss record 1 of 1
==14268== at 0x4C2B1EC: operator new(unsigned long) (in /usr/lib/valgrind/vgpreload_memcheck-amd64-linux.so)
==14268== by 0x4007C7: main (in /home/tommycc/garbage)
==14268==
==14268== LEAK SUMMARY:
==14268== definitely lost: 4 bytes in 1 blocks
==14268== indirectly lost: 0 bytes in 0 blocks
==14268== possibly lost: 0 bytes in 0 blocks
==14268== still reachable: 0 bytes in 0 blocks
==14268== suppressed: 0 bytes in 0 blocks
==14268==
==14268== For counts of detected and suppressed errors, rerun with: -v
==14268== ERROR SUMMARY: 1 errors from 1 contexts (suppressed: 0 from 0)
可以發現這兩行,指出了錯誤點。
==14268== at 0x4C2B1EC: operator new(unsigned long) (in /usr/lib/valgrind/vgpreload_memcheck-amd64-linux.so)
==14268== by 0x4007C7: main (in /home/tommycc/garbage)
Cachegrind
$valgrind --tool=cachegrind
它可以分析你程式的快取優化程度。它的結果總共有以下類別。以下擷取至valgrind manual
- I cache reads (Ir, which equals the number of instructions executed), I1 cache read misses (I1mr) and LL cache instruction read misses (ILmr).
- D cache reads (Dr, which equals the number of memory reads), D1 cache read misses (D1mr), and LL cache data read misses (DLmr).
- D cache writes (Dw, which equals the number of memory writes), D1 cache write misses (D1mw), and LL cache data write misses (DLmw).
- Conditional branches executed (Bc) and conditional branches mispredicted (Bcm).
- Indirect branches executed (Bi) and indirect branches mispredicted (Bim).
一般來說I和D是首要分析的部份。以下的範例是二維陣列存取,我們都知道二維陣列在記憶體上其實是一維的,所以(row major)先row在column會比(column major)先column在row快。我們先執行row major的code如以下。
 for (int i = 0 ; i < 1000 ; i++ ){
     for (int j = 0 ; j < 1000 ; j++ ){
         a[i][j] = i+j;
     }
 }
結果如下。
==11719== Cachegrind, a cache and branch-prediction profiler
==11719== Copyright (C) 2002-2015, and GNU GPL'd, by Nicholas Nethercote et al.
==11719== Using Valgrind-3.12.0 and LibVEX; rerun with -h for copyright info
==11719== Command: ./tt
==11719==
--11719-- warning: L3 cache found, using its data for the LL simulation.
==11719==
==11719== I   refs:      16,204,946
==11719== I1  misses:         1,401
==11719== LLi misses:         1,357
==11719== I1  miss rate:       0.01%
==11719== LLi miss rate:       0.01%
==11719==
==11719== D   refs:       7,729,575  (6,536,262 rd   + 1,193,313 wr)
==11719== D1  misses:        78,407  (   13,698 rd   +    64,709 wr)
==11719== LLd misses:        71,617  (    7,734 rd   +    63,883 wr)
==11719== D1  miss rate:        1.0% (      0.2%     +       5.4%  )
==11719== LLd miss rate:        0.9% (      0.1%     +       5.4%  )
==11719==
==11719== LL refs:           79,808  (   15,099 rd   +    64,709 wr)
==11719== LL misses:         72,974  (    9,091 rd   +    63,883 wr)
==11719== LL miss rate:         0.3% (      0.0%     +       5.4%  )
特別注意D1 miss rate是1.0%。接下來是column major的code,如下。
for (int i = 0 ; i < 1000 ; i++ ){
    for (int j = 0 ; j < 1000 ; j++ ){
        a[j][i] = i+j;
    }
}
結果如下。
==11522== Cachegrind, a cache and branch-prediction profiler
==11522== Copyright (C) 2002-2015, and GNU GPL'd, by Nicholas Nethercote et al.
==11522== Using Valgrind-3.12.0 and LibVEX; rerun with -h for copyright info
==11522== Command: ./tt
==11522==
--11522-- warning: L3 cache found, using its data for the LL simulation.
==11522==
==11522== I   refs:      16,204,946
==11522== I1  misses:         1,401
==11522== LLi misses:         1,357
==11522== I1  miss rate:       0.01%
==11522== LLi miss rate:       0.01%
==11522==
==11522== D   refs:       7,729,575  (6,536,262 rd   + 1,193,313 wr)
==11522== D1  misses:     1,015,906  (   13,698 rd   + 1,002,208 wr)
==11522== LLd misses:        71,617  (    7,734 rd   +    63,883 wr)
==11522== D1  miss rate:       13.1% (      0.2%     +      84.0%  )
==11522== LLd miss rate:        0.9% (      0.1%     +       5.4%  )
==11522==
==11522== LL refs:        1,017,307  (   15,099 rd   + 1,002,208 wr)
==11522== LL misses:         72,974  (    9,091 rd   +    63,883 wr)
==11522== LL miss rate:         0.3% (      0.0%     +       5.4%  )
可以發現D1 miss rate大幅上升至13.1%。另外cachegrind一樣會產生output file,可以透過cg_annotate分析,或是用Kcahcegrind分析。
Callgrind
用來分析整個程式的function call數目。
$valgrind --tool=callgrind 程式名稱
這會開始執行你的程式,通常會執行的比較慢。在執行過程中,你可以透過$callgrind_control -e -b或是$callgrind_control -b 來看程式當下執行的function call backtrace。以下是費氏數列遞迴版結果。
 PID 6989: ./fb
sending command status internal to pid 6989

  Totals:           Ir
   Th 1  2,560,275,485

  Frame:             Ir Backtrace for Thread 1
   [ 0]  23,685,553,356 fb(long long) (58138276 x)
   [ 1]  41,379,358,433 fb(long long) (58138297 x)
   [ 2]  41,379,358,449 fb(long long) (58138297 x)
   [ 3]  41,379,358,465 fb(long long) (58138297 x)
   [ 4]  41,379,358,481 fb(long long) (58138297 x)
   [ 5]  41,379,358,497 fb(long long) (58138297 x)
   [ 6]  41,379,358,513 fb(long long) (58138297 x)
   [ 7]  41,379,358,529 fb(long long) (58138297 x)
   [ 8]  41,379,358,545 fb(long long) (58138297 x)
   [ 9]  23,685,553,523 fb(long long) (58138276 x)
   [10]  41,379,364,892 fb(long long) (58138297 x)
   [11]  41,379,364,908 fb(long long) (58138297 x)
   [12]  41,379,364,924 fb(long long) (58138297 x)
   [13]  23,685,559,902 fb(long long) (58138276 x)
   [14]  23,685,630,165 fb(long long) (58138276 x)
   [15]  41,379,619,162 fb(long long) (58138297 x)
   [16]  41,379,619,178 fb(long long) (58138297 x)
   [17]  41,379,619,194 fb(long long) (58138297 x)
   [18]  41,379,619,210 fb(long long) (58138297 x)
   [19]  23,685,814,188 fb(long long) (58138276 x)
   [20]  41,382,920,321 fb(long long) (58138297 x)
   [21]  41,382,920,337 fb(long long) (58138297 x)
   [22]  23,689,115,315 fb(long long) (58138276 x)
   [23]  41,405,546,424 fb(long long) (58138297 x)
   [24]  41,405,546,440 fb(long long) (58138297 x)
   [25]  23,711,741,418 fb(long long) (58138276 x)
   [26]  41,560,627,883 fb(long long) (58138297 x)
   [27]  23,866,822,861 fb(long long) (58138276 x)
   [28]  24,523,758,344 fb(long long) (58138276 x)
   [29]  43,937,442,813 fb(long long) (58138297 x)
   [30]   2,558,084,449 fb(long long) (1 x)
   [31]   2,558,084,465 fb(long long) (1 x)
   [32]   2,558,084,472 main (1 x)
   [33]   2,558,187,428 (below main) (1 x)
   [34]   2,558,187,439 _start (1 x)
   [35]               . 0x0000000000000d70
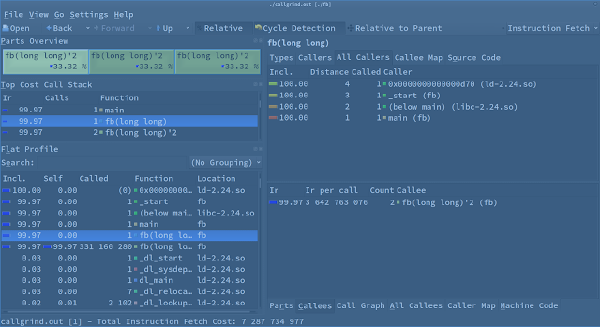
可以看到執行當下的遞迴到哪裡,不過由於費氏數列浮動快,這用callgrind_control -e -b的深度會不同。要看到整個function的呼叫次數,可以透過callgrind執行完產生的calgrind.out.pid檔案,這時有兩種分析這個檔案的方式,一是透過callgrind_annotate callgrind.out.pid 來看結果,另一是用KCachegrind (KDE應用程式)。以下是KCachegrind結果,可以看到左下角的框框,fb被call了1+331160280次(第一層call+第二層以上call)。
helgrind
$valgrind --tool=helgrind
這次我們使用官方範例。
#include <pthread.h>

int var = 0;

void* child_fn ( void* arg ) {
   var++; /* Unprotected relative to parent */ /* this is line 6 */
   return NULL;
}

int main ( void ) {
   pthread_t child;
   pthread_create(&child, NULL, child_fn, NULL);
   var++; /* Unprotected relative to child */ /* this is line 13 */
   pthread_join(child, NULL);
   return 0;
}
很明顯的var沒有做mutex lock,會有race。結果如下。
==19156== Helgrind, a thread error detector
==19156== Copyright (C) 2007-2015, and GNU GPL'd, by OpenWorks LLP et al.
==19156== Using Valgrind-3.12.0 and LibVEX; rerun with -h for copyright info
==19156== Command: ./race
==19156==
==19156== ---Thread-Announcement------------------------------------------
==19156==
==19156== Thread #1 is the program's root thread
==19156==
==19156== ---Thread-Announcement------------------------------------------
==19156==
==19156== Thread #2 was created
==19156==    at 0x51427AE: clone (in /usr/lib/libc-2.24.so)
==19156==    by 0x4E431A9: create_thread (in /usr/lib/libpthread-2.24.so)
==19156==    by 0x4E44C12: pthread_create@@GLIBC_2.2.5 (in /usr/lib/libpthread-2.24.so)
==19156==    by 0x4C31810: ??? (in /usr/lib/valgrind/vgpreload_helgrind-amd64-linux.so)
==19156==    by 0x4C328FD: pthread_create@* (in /usr/lib/valgrind/vgpreload_helgrind-amd64-linux.so)
==19156==    by 0x4005C6: main (in /home/tommycc/race)
==19156==
==19156== ----------------------------------------------------------------
==19156==
==19156== Possible data race during read of size 4 at 0x60103C by thread #1
==19156== Locks held: none
==19156==    at 0x4005C7: main (in /home/tommycc/race)
==19156==
==19156== This conflicts with a previous write of size 4 by thread #2
==19156== Locks held: none
==19156==    at 0x400597: child_fn (in /home/tommycc/race)
==19156==    by 0x4C31A04: ??? (in /usr/lib/valgrind/vgpreload_helgrind-amd64-linux.so)
==19156==    by 0x4E44453: start_thread (in /usr/lib/libpthread-2.24.so)
==19156==  Address 0x60103c is 0 bytes inside data symbol "var"
==19156==
==19156== ----------------------------------------------------------------
==19156==
==19156== Possible data race during write of size 4 at 0x60103C by thread #1
==19156== Locks held: none
==19156==    at 0x4005D0: main (in /home/tommycc/race)
==19156==
==19156== This conflicts with a previous write of size 4 by thread #2
==19156== Locks held: none
==19156==    at 0x400597: child_fn (in /home/tommycc/race)
==19156==    by 0x4C31A04: ??? (in /usr/lib/valgrind/vgpreload_helgrind-amd64-linux.so)
==19156==    by 0x4E44453: start_thread (in /usr/lib/libpthread-2.24.so)
==19156==  Address 0x60103c is 0 bytes inside data symbol "var"
==19156==
==19156==
==19156== For counts of detected and suppressed errors, rerun with: -v
==19156== Use --history-level=approx or =none to gain increased speed, at
==19156== the cost of reduced accuracy of conflicting-access information
==19156== ERROR SUMMARY: 2 errors from 2 contexts (suppressed: 0 from 0)
她很明確得告訴我們有可能的race問題。而且名稱叫做var。結果十分直觀。
Massif
$ valgrind --tool=massif 程式名稱`
他是用來分析data segement 中heap使用。
heap在data sgment通常是由malloc等函式創造的,是適當的優化減少heap可以paging和盡量避開使用swap space。
在執行完massif後會有一個massif.out.pid檔,可以透過ms_print來印出。不過一般高速運行的程式,他的malloc和free執行很快,在輸出圖形的時候看起來是一條線,所以可以透過valgrind --tool=massif --time-unit=B 程式名稱 讓massif透過allocate與deallcoate記憶體大小作圖。範例程式如下。
#include<stdio.h>
#include<stdlib.h>

int main()
{
    malloc(1000);
    int* a[10];
    for (int i = 0 ; i < 10 ; i++ )
        a[i] = malloc(1000);
    for (int i = 0 ; i < 10 ; i++ )
        free(a[i]);
}
結果如下。
--------------------------------------------------------------------------------
Command:            ./heap
Massif arguments:   --time-unit=B
ms_print arguments: massif.out.2213
--------------------------------------------------------------------------------


    KB
10.91^                                     ####
     |                                     #
     |                                  :::#   :::
     |                                  :  #   :
     |                              @@@@:  #   :  ::::
     |                              @   :  #   :  :
     |                           :::@   :  #   :  :   :::
     |                           :  @   :  #   :  :   :
     |                        ::::  @   :  #   :  :   :  :::
     |                        :  :  @   :  #   :  :   :  :
     |                    :::::  :  @   :  #   :  :   :  :  ::::
     |                 ::::   :  :  @   :  #   :  :   :  :  :   :::
     |                 :  :   :  :  @   :  #   :  :   :  :  :   :
     |             :::::  :   :  :  @   :  #   :  :   :  :  :   :  ::::
     |             :   :  :   :  :  @   :  #   :  :   :  :  :   :  :
     |          ::::   :  :   :  :  @   :  #   :  :   :  :  :   :  :   :::
     |          :  :   :  :   :  :  @   :  #   :  :   :  :  :   :  :   :
     |      :::::  :   :  :   :  :  @   :  #   :  :   :  :  :   :  :   :  :::
     |      :   :  :   :  :   :  :  @   :  #   :  :   :  :  :   :  :   :  :
     |   ::::   :  :   :  :   :  :  @   :  #   :  :   :  :  :   :  :   :  :  @
   0 +----------------------------------------------------------------------->KB
     0                                                                   20.84

Number of snapshots: 23
 Detailed snapshots: [9, 12 (peak), 22]

--------------------------------------------------------------------------------
  n        time(B)         total(B)   useful-heap(B) extra-heap(B)    stacks(B)
--------------------------------------------------------------------------------
  0              0                0                0             0            0
  1          1,016            1,016            1,000            16            0
  2          2,032            2,032            2,000            32            0
  3          3,048            3,048            3,000            48            0
  4          4,064            4,064            4,000            64            0
  5          5,080            5,080            5,000            80            0
  6          6,096            6,096            6,000            96            0
  7          7,112            7,112            7,000           112            0
  8          8,128            8,128            8,000           128            0
  9          9,144            9,144            9,000           144            0
98.43% (9,000B) (heap allocation functions) malloc/new/new[], --alloc-fns, etc.
->87.49% (8,000B) 0x400569: main (in /home/tommycc/heap)
|
->10.94% (1,000B) 0x400556: main (in /home/tommycc/heap)

--------------------------------------------------------------------------------
  n        time(B)         total(B)   useful-heap(B) extra-heap(B)    stacks(B)
--------------------------------------------------------------------------------
 10         10,160           10,160           10,000           160            0
 11         11,176           11,176           11,000           176            0
 12         11,176           11,176           11,000           176            0
98.43% (11,000B) (heap allocation functions) malloc/new/new[], --alloc-fns, etc.
->89.48% (10,000B) 0x400569: main (in /home/tommycc/heap)
|
->08.95% (1,000B) 0x400556: main (in /home/tommycc/heap)

--------------------------------------------------------------------------------
  n        time(B)         total(B)   useful-heap(B) extra-heap(B)    stacks(B)
--------------------------------------------------------------------------------
 13         12,192           10,160           10,000           160            0
 14         13,208            9,144            9,000           144            0
 15         14,224            8,128            8,000           128            0
 16         15,240            7,112            7,000           112            0
 17         16,256            6,096            6,000            96            0
 18         17,272            5,080            5,000            80            0
 19         18,288            4,064            4,000            64            0
 20         19,304            3,048            3,000            48            0
 21         20,320            2,032            2,000            32            0
 22         21,336            1,016            1,000            16            0
98.43% (1,000B) (heap allocation functions) malloc/new/new[], --alloc-fns, etc.
->98.43% (1,000B) 0x400556: main (in /home/tommycc/heap)
|
->00.00% (0B) in 1+ places, all below ms_print's threshold (01.00%
可以看到malloc和free的作用。
其他工具
有些是valgrind的開發工具所以就跳過了。
ref:http://valgrind.org/docs/manual/manual.html
ㄧ
ㄧ
ㄧ
Written with StackEdit.